PlagiarismSearch.com Statistical Report
Global Plagiarism Trends 2018–2025: What 87M Checks Reveal About Academic Integrity
A platform-observed statistical report based on approximately 87.24 million anonymized plagiarism checks conducted through PlagiarismSearch.com between 2018 and 2025.
Report contents
Overview
Executive Summary
PlagiarismSearch.com analyzed approximately 87.24 million anonymized plagiarism checks conducted between 2018 and 2025. The expanded dataset includes 17.35 million checks from 2025 and provides a platform-observed view of how the average detected share of matched or potentially non-original content changed across submitted documents.
The main finding is not simply that the observed rate changed. The more important insight is that plagiarism statistics require context. A lower observed rate may reflect changes in writing behavior, but it may also reflect broader routine screening, different document types, changes in client composition, and evolving academic integrity workflows.
What the 2025 data shows
The 2025 platform-observed weighted average rate was 9.73%, calculated across the 2025 source rows and weighted by the number of checks.
What it does not prove
The result does not prove that plagiarism became less common worldwide or that a particular country, institution, or group improved or declined.
Definitions
What This Report Measures
This report is based on anonymized and aggregated plagiarism checks performed through the PlagiarismSearch.com platform. It measures the average detected share of matched or potentially non-original content in submitted documents.
Observed plagiarism rate
Observed plagiarism rate refers to the average detected share of matched or potentially non-original content in documents submitted for checking. It is not the percentage of students, authors, or institutions involved in plagiarism, and it does not establish intent or confirmed misconduct.
| This report measures | This report does not measure |
|---|---|
| Average detected matched content in submitted documents | The percentage of students who plagiarized |
| Platform-observed trends over time | The true prevalence of plagiarism in a country |
| Aggregated, anonymized checking patterns | Student intent or confirmed academic misconduct |
| Country-level data coverage where sample size allows | The quality of a country’s education system |
| Changes within the PlagiarismSearch.com submitted-document dataset | A universal global census of plagiarism |
Methodology
Methodology and Data Limitations
The report uses anonymized and aggregated plagiarism check data from PlagiarismSearch.com. Personal identifiers are not included. The results reflect patterns within submitted documents checked through the platform.
Country-level results are interpreted cautiously because submission volume can be influenced by platform usage, client composition, document type, language mix, institutional policy, and checking workflow. Country check volume is therefore treated as a coverage indicator—not as evidence that plagiarism is more or less common in a country.
2025 weighted average
The 2025 figure is calculated as a weighted average: each source-row observed rate is weighted by the number of checks in that row.
Conceptually: Σ(checks × observed rate) ÷ Σ(checks).
Historical annual series
The 2018–2024 values use the approved annual reporting series. The 2025 value is added from the corrected exact 2025 source table.
- All data is aggregated and anonymized.
- Observed rate refers to detected matched content in submitted documents.
- Check volume reflects platform usage and sample coverage.
- Low-volume country data is not used for strong conclusions.
- Country interpretation uses confidence tiers.
- The report avoids claims about intent, misconduct, or national behavior.
Annual data
Global Observed Trend and Dataset Size, 2018–2025
The annual series moves in waves rather than in a straight line. The 2025 observed rate is lower than the preceding years in the platform dataset, but it should not be interpreted as proof of a universal global decline in plagiarism.
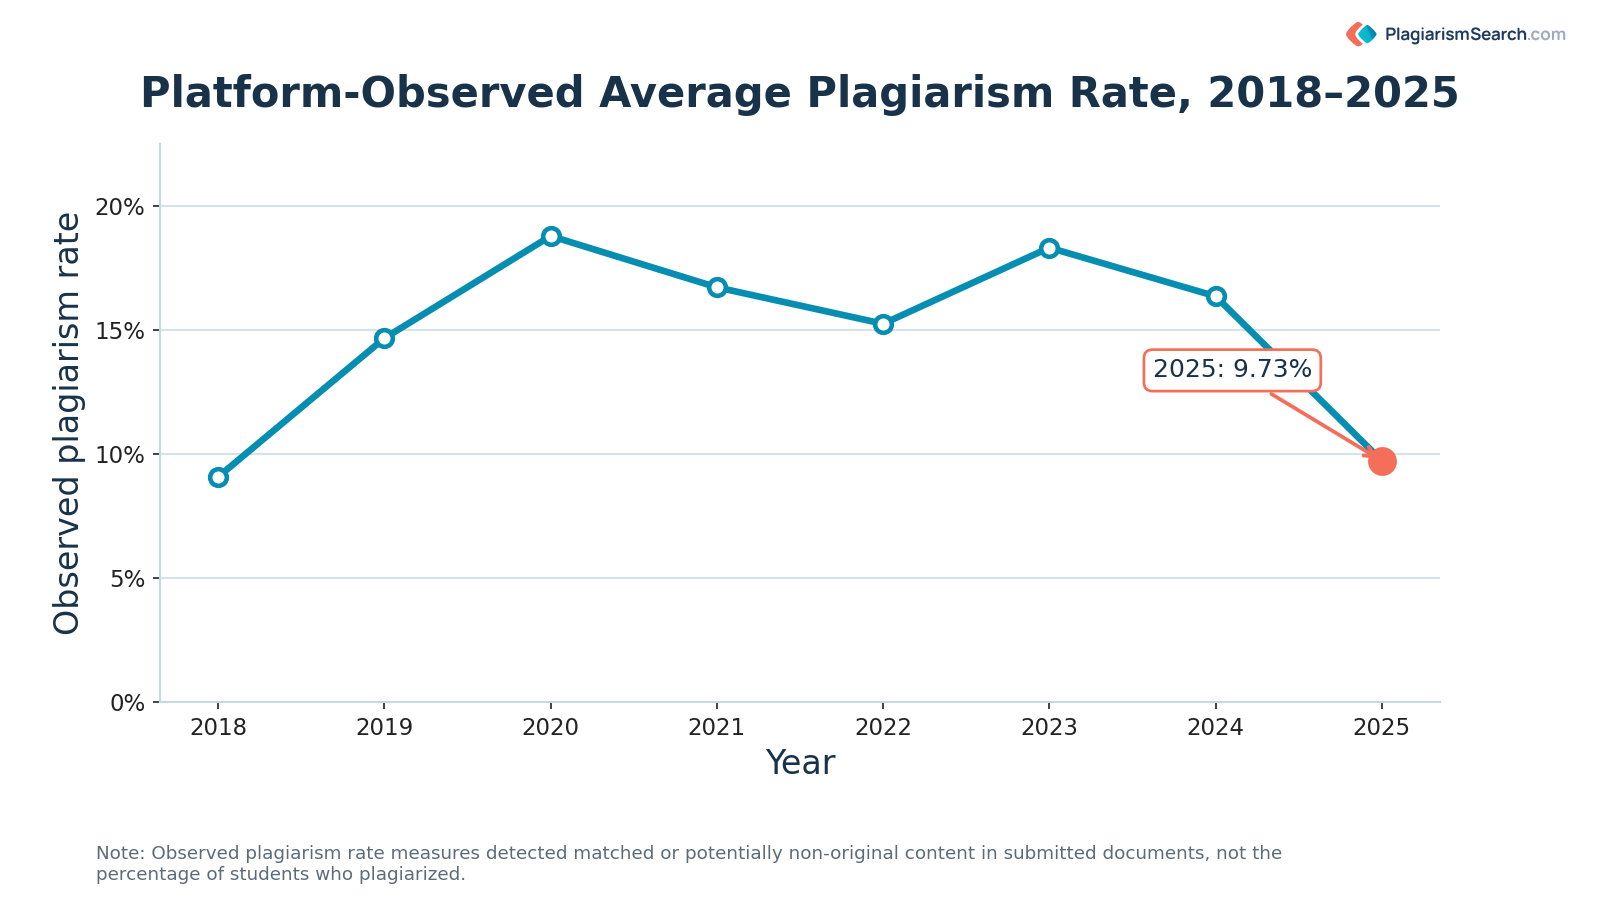 Platform-observed average plagiarism rate, 2018–2025. The measure reflects detected matched or potentially non-original content in submitted documents, not the percentage of students who plagiarized.
| Year | Checks included | Platform-observed average rate |
|---|---|---|
| 2018 | 4.2M | 9.08% |
| 2019 | 5.8M | 14.67% |
| 2020 | 7.2M | 18.79% |
| 2021 | 10.3M | 16.72% |
| 2022 | 11.8M | 15.25% |
| 2023 | 13.9M | 18.32% |
| 2024 | 16.7M | 16.36% |
| 2025 | 17.35M | 9.73% |
Rounding note: Annual check volumes for 2018–2024 are displayed as rounded values. The 87.24M combined total uses the approved 69.89M reporting base for 2018–2024 plus the exact 2025 total.
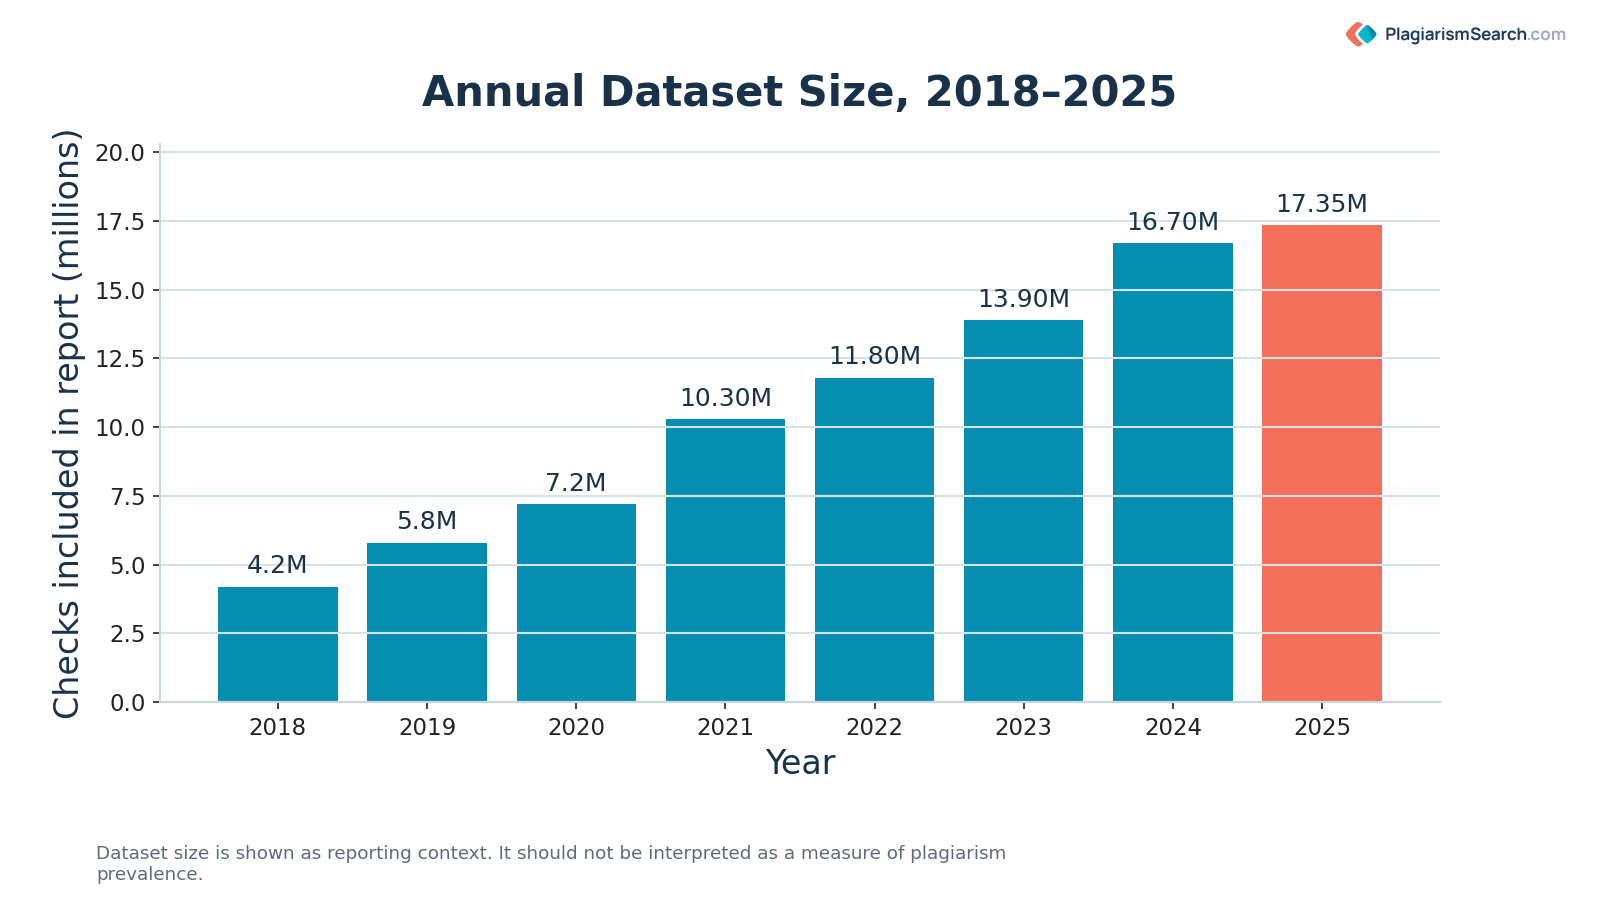 Annual dataset size is shown as reporting context. A larger dataset does not mean plagiarism is more prevalent.
Interpretation
Why the 2025 Plagiarism Rate Needs Context
At first glance, a lower observed rate may look like a straightforward improvement. However, when originality checking becomes more common and more institutional, the dataset can include a wider range of ordinary, low-risk documents.
As a result, the average detected rate can fall even when academic integrity remains an important concern. The 2025 number should therefore be read as a platform-observed signal, not as a universal statement about behavior worldwide.
| Possible factor | How it may affect the observed rate |
|---|---|
| Routine institutional screening | Adds more ordinary, low-risk documents to the dataset |
| Changes in client composition | Changes the mix of documents represented |
| Different document types | Essays, reports, theses, drafts, and articles may show different rates |
| Pre-submission checking | May reduce similarity before final submission |
| Academic integrity policies | Can change how and when documents are checked |
| Improved citation practices | May reduce detected overlap |
| Platform usage by country | Affects sample coverage, not necessarily plagiarism behavior |
Checking workflow
Why Plagiarism Rates Can Fall While Checks Increase
Large-scale checking data can be counterintuitive. A platform may process more documents while showing a lower average rate when checking expands from suspicious or high-risk cases to routine review of many ordinary documents.
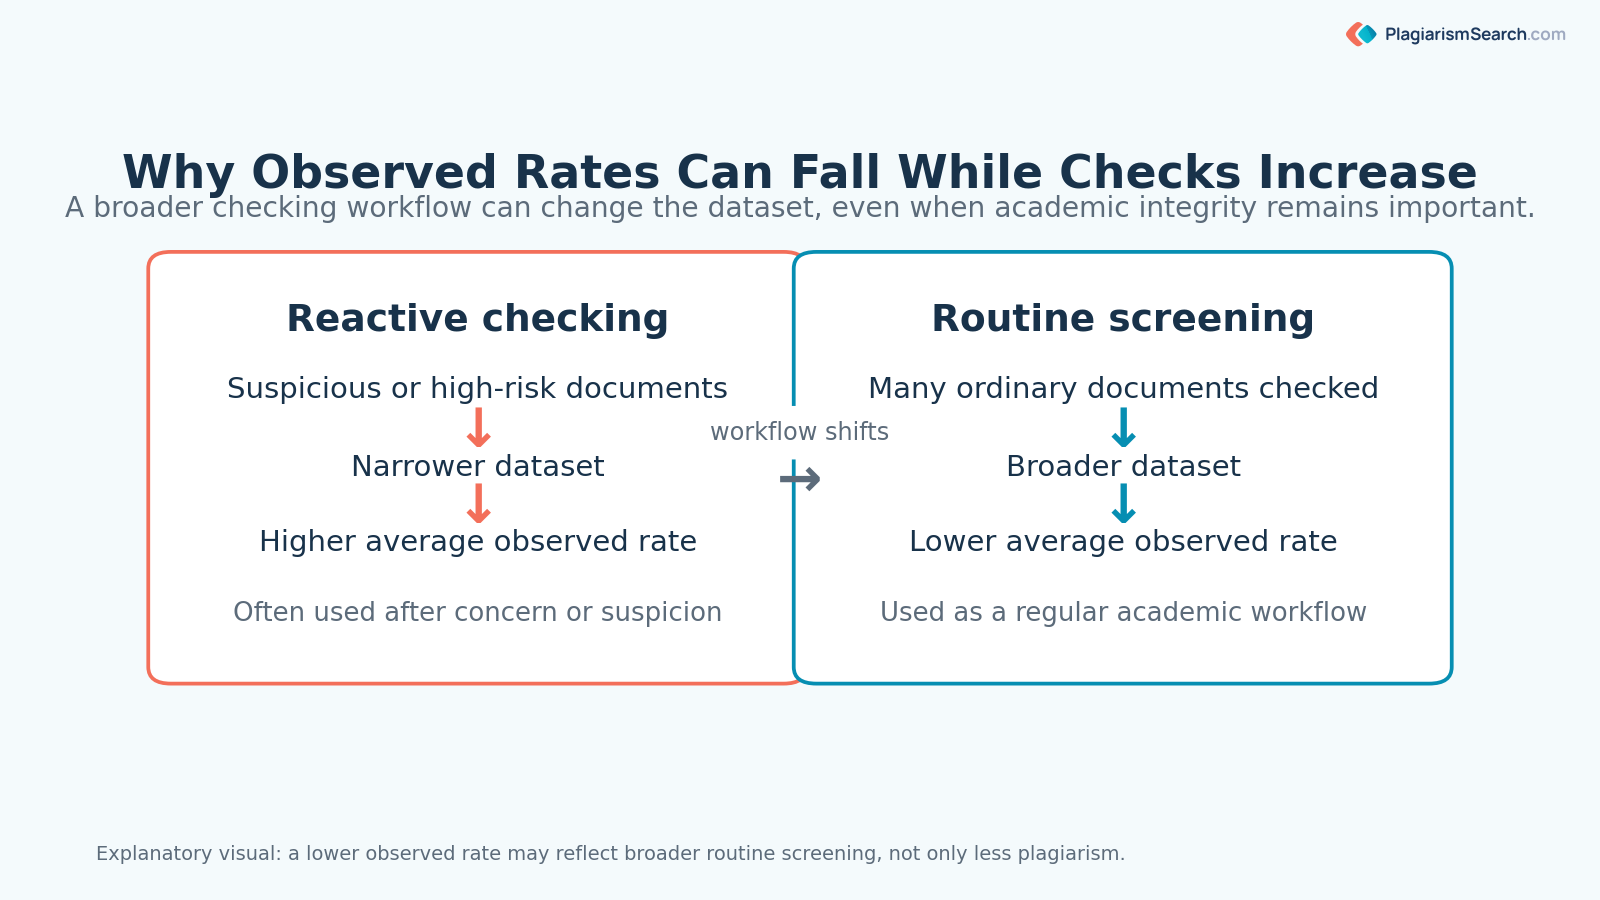 A broader checking workflow can change the dataset. Routine screening may include drafts, pre-submission checks, and many ordinary documents.
Country-level data
Country-Level Data: Coverage, Not Ranking
A country with more checks in the dataset is not necessarily a country with more plagiarism. It may simply be a country where PlagiarismSearch.com was used more often by individuals, institutions, or organizations.
For this reason, this report does not rank countries by plagiarism behavior. It uses confidence tiers to show where country-level data can support cautious interpretation and where the sample should remain limited.
| Tier | 2025 checks | Interpretation rule |
|---|---|---|
| High-confidence | ≥100,000 | Suitable for cautious country-level discussion |
| Directional | 10,000–99,999 | Useful for directional signals only |
| Limited | 1,000–9,999 | Supplementary use; avoid strong conclusions |
| Insufficient | <1,000 | Exact observed rate suppressed in the public country appendix |
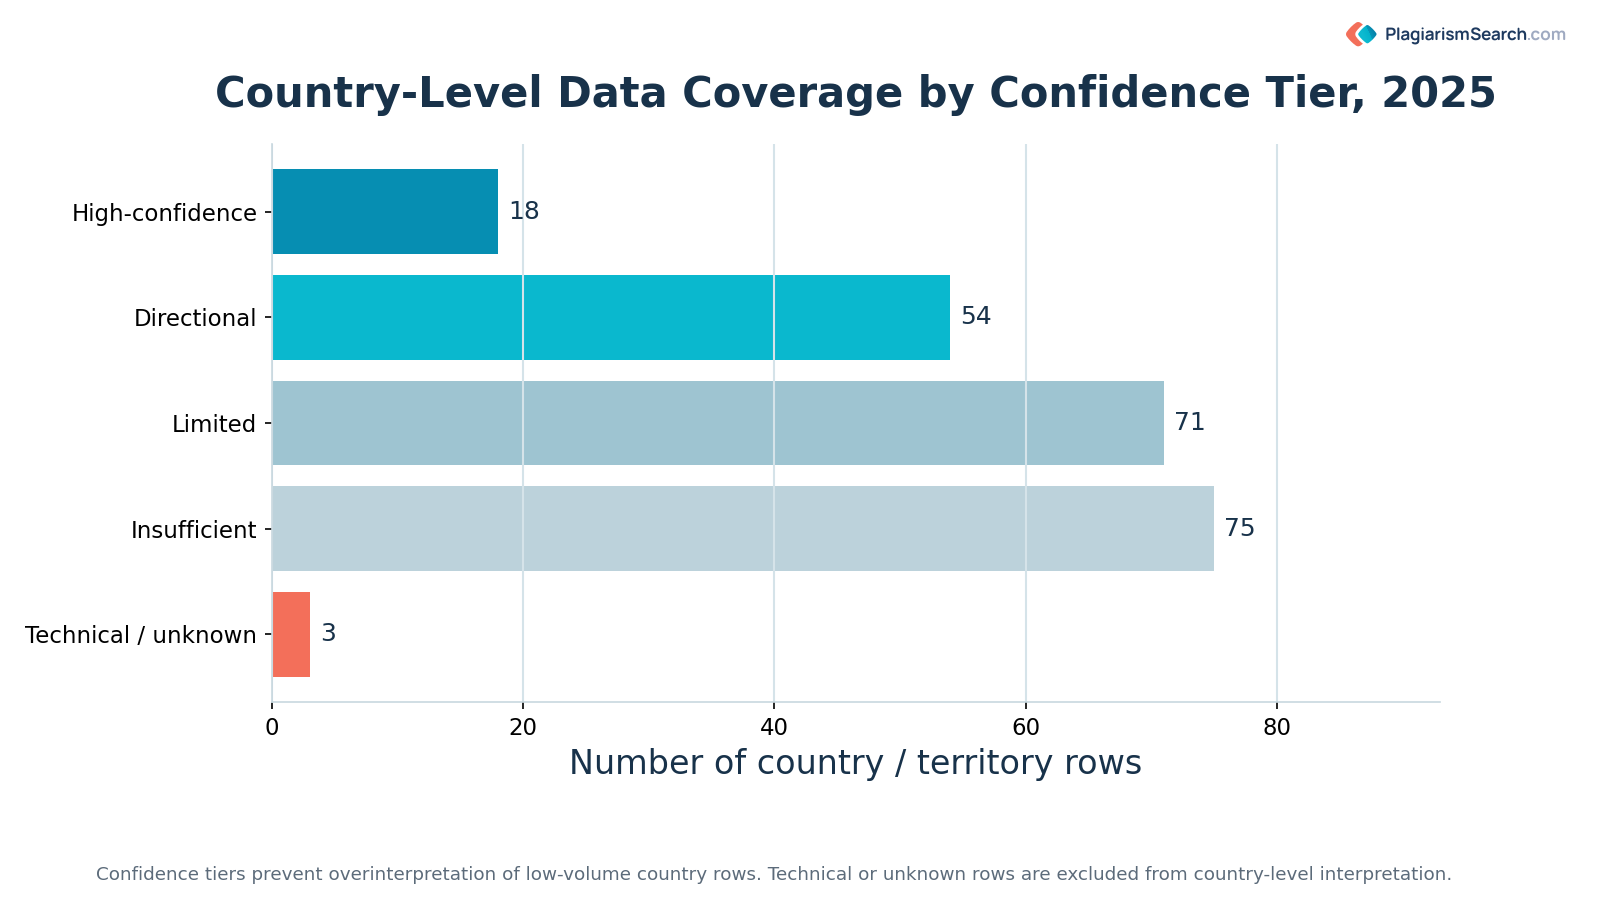 Confidence tiers reduce the risk of overinterpreting low-volume country rows. The chart describes data coverage, not national plagiarism prevalence.
Country-Level Appendix: 2025 Platform-Observed Plagiarism Data
Download the 15-page appendix with 218 country and territory rows, approximate check volumes, observed rates where the sample supports publication, and confidence-tier guidance.
Country-Level Plagiarism Trends 2018–2025
Explore the 18-page longitudinal report with fixed-scale country charts, a shared annual platform baseline, contextual tables, and extended geographic coverage.
Responsible use
How to Interpret Plagiarism Statistics Responsibly
The same number can mean different things depending on sample size, document type, checking policy, and institutional context.
- Check sample size before comparing countries or groups.
- Separate observed similarity from confirmed misconduct.
- Do not treat check volume as plagiarism prevalence.
- Consider document type, language, assignment design, and policy.
- Use trend data for prevention and education, not only enforcement.
- Combine automated detection with human academic review.
- Avoid rankings without a defensible methodological basis.
Practical application
What Institutions Can Learn from Plagiarism Statistics
Plagiarism data should not be used as a disciplinary shortcut. Its stronger use is diagnostic: it can help institutions identify where students need support, where policies need clarification, and where review workflows should become more consistent.
| Question | Why it matters |
|---|---|
| Are high-similarity documents concentrated in specific assignment types? | May reveal opportunities to improve assignment design |
| Are students checking drafts before final submission? | May indicate preventive use of plagiarism checking |
| Do rates change after citation training? | May help evaluate educational intervention |
| Are repeated patterns concentrated in certain departments or courses? | May help target academic support |
| Is manual review part of the process? | Reduces unsupported or unfair conclusions |
| Are AI and plagiarism policies clearly separated? | Prevents confusion between different academic integrity issues |
Download
Download the Research Package
The web hub is the canonical location for methodology, charts, interpretation guidance, and updates. Three downloadable PDFs support different levels of reuse: the global overview, the complete 2025 country appendix, and the longitudinal country-trends analysis.
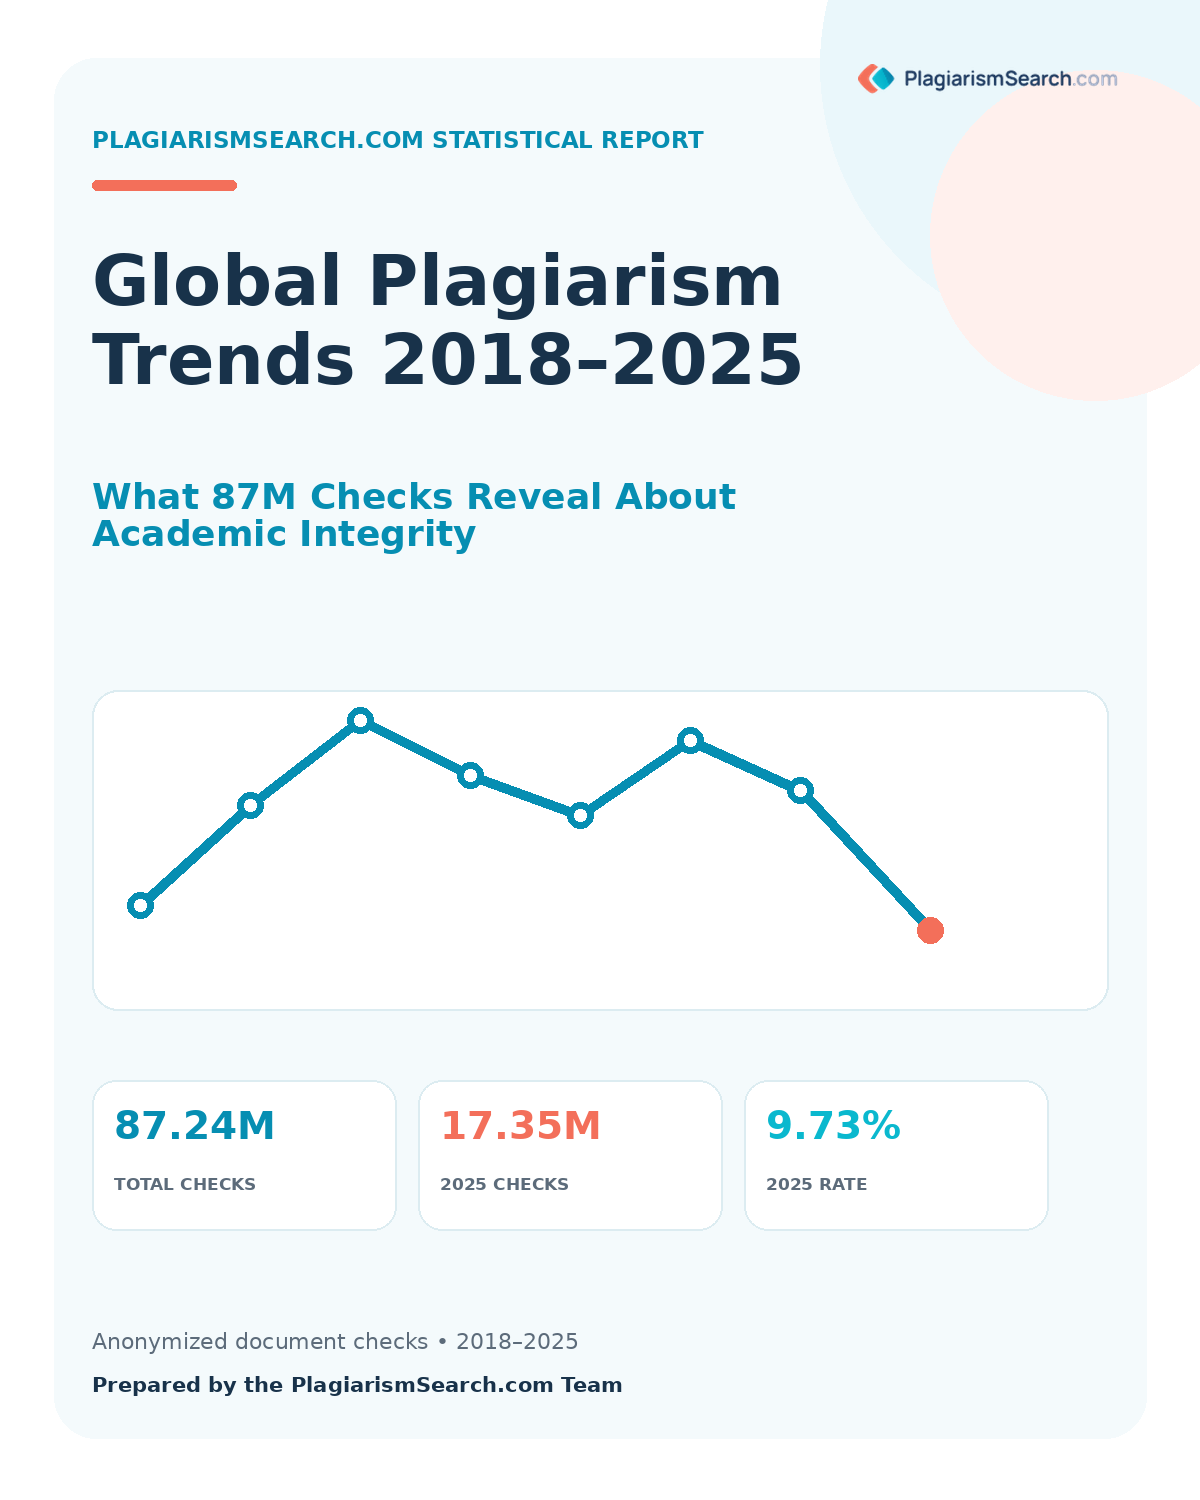
Global Plagiarism Trends 2018–2025
Key findings, methodology, annual charts, interpretation guidance, and suggested citation.
Download Main Report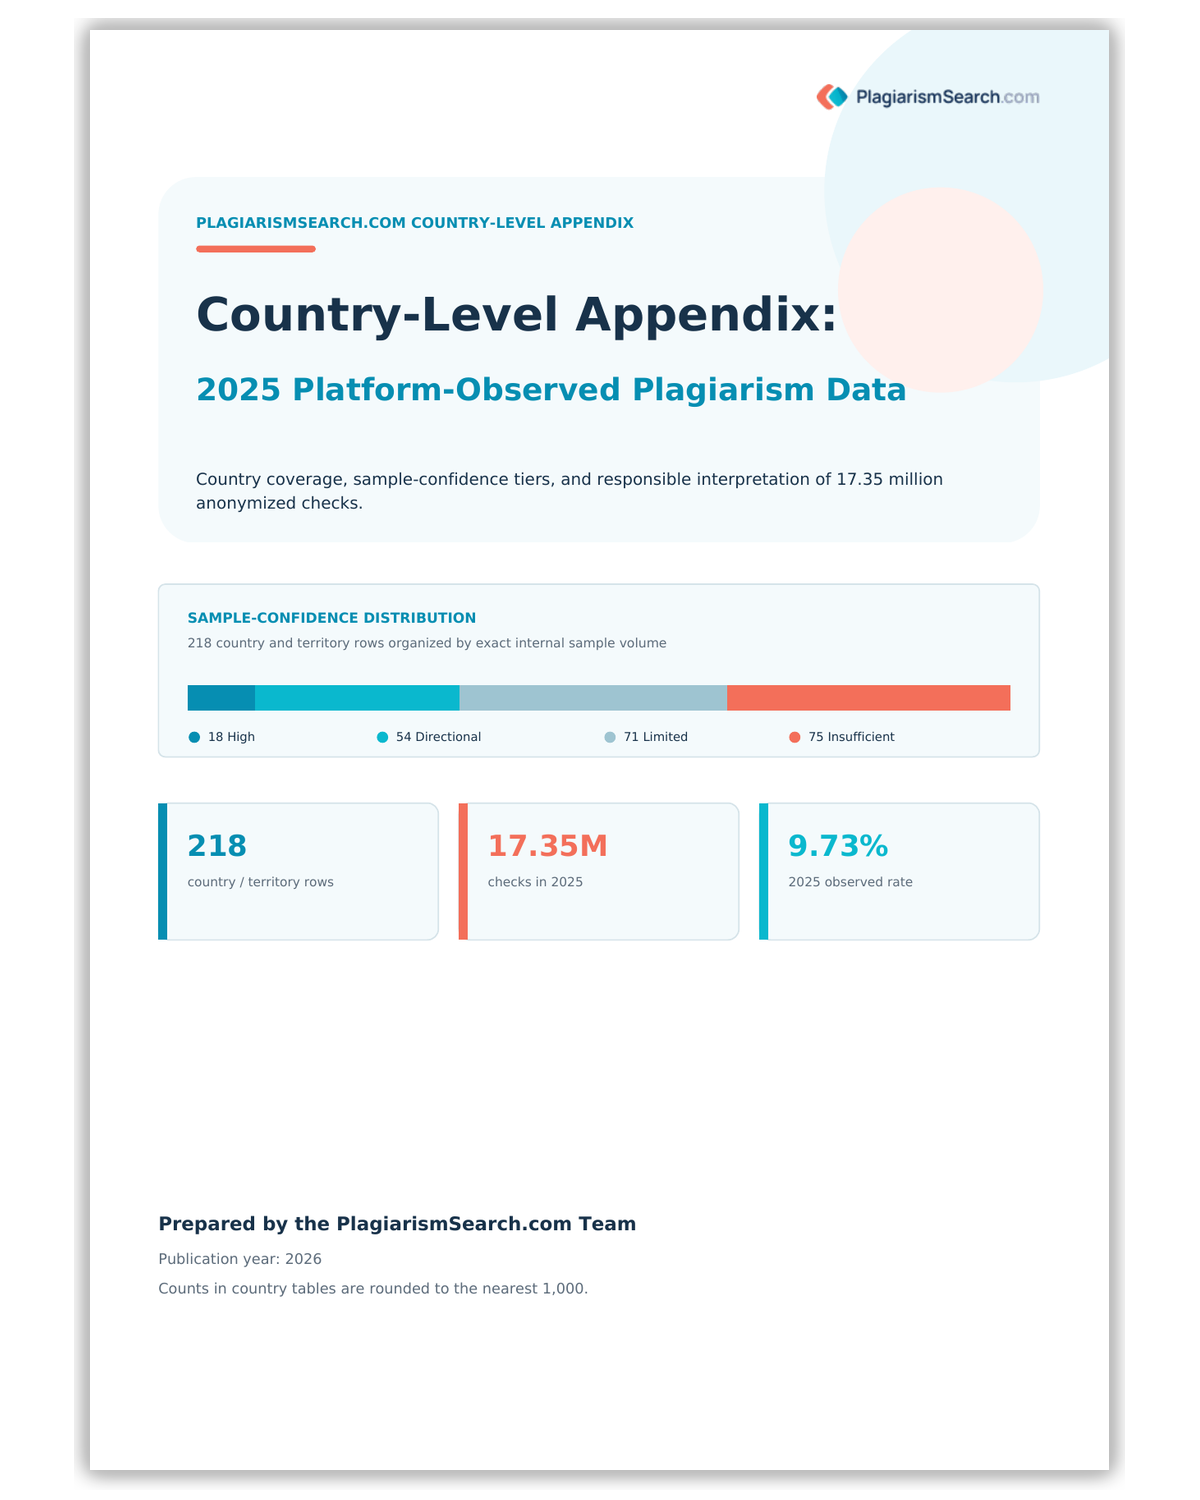
Country-Level Appendix: 2025 Data
Alphabetical country and territory tables organized by sample-confidence tier.
Download Country Appendix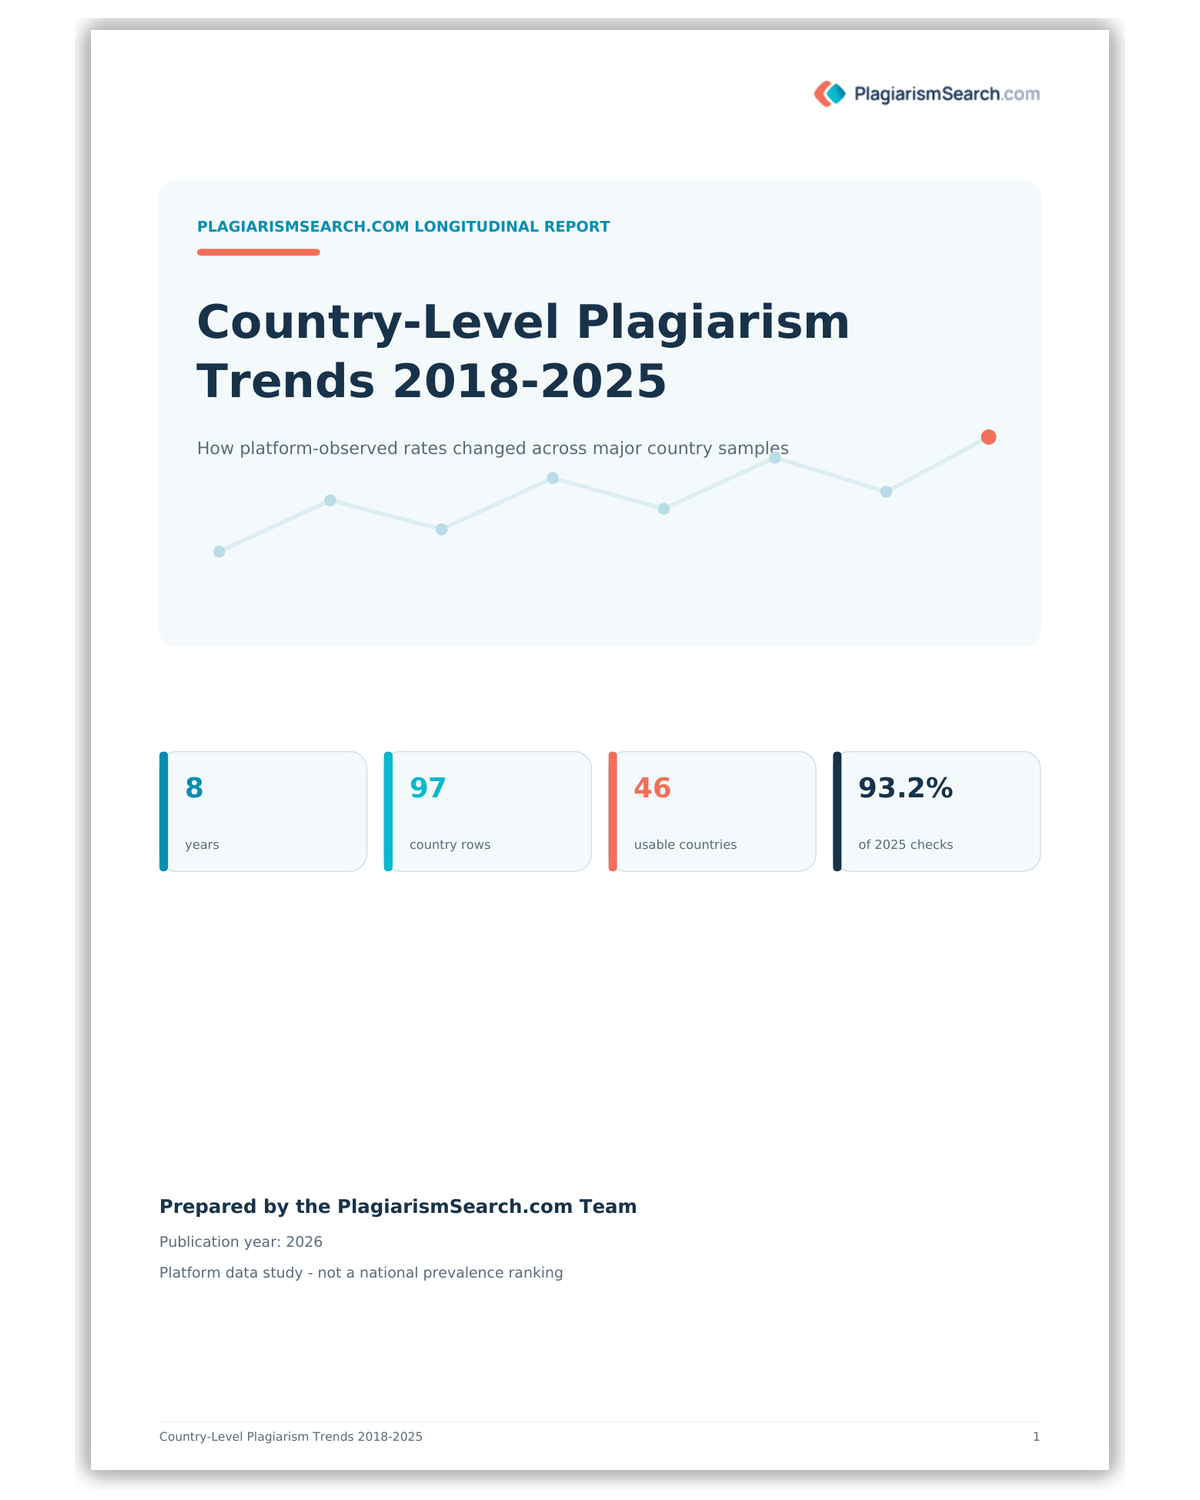
Country-Level Plagiarism Trends
Longitudinal analysis with Core charts, Contextual tables, and Extended country coverage.
Download Trends ReportSuggested citation
PlagiarismSearch.com. “Global Plagiarism Trends 2018–2025: What 87M Checks Reveal About Academic Integrity.” PlagiarismSearch.com, 2026. https://plagiarismsearch.com/global-plagiarism-trends-2018-2025
Frequently asked questions
Understanding the Report
-
How many checks were analyzed?
The report covers approximately 87.24 million anonymized checks conducted between 2018 and 2025, including 17.35 million checks from 2025.
-
What does the 2025 rate of 9.73% mean?
It is the 2025 platform-observed weighted average share of detected matched or potentially non-original content in submitted documents. It is not the percentage of students who plagiarized.
-
Did global plagiarism decline in 2025?
The platform-observed average was lower in 2025, but the dataset cannot prove a universal global decline. Client composition, document types, checking workflows, and routine screening may also affect the average.
-
Why does the report not rank countries?
Country-level check volume reflects sample coverage and platform usage, not national plagiarism prevalence. Ranking countries would invite unsupported comparisons.
-
Why are confidence tiers used?
Confidence tiers distinguish higher-volume country rows from limited samples and help prevent overinterpretation.
-
Where can I find the country-level results?
The 2025 Country-Level Appendix contains 218 country and territory rows organized alphabetically within confidence tiers. The separate Country-Level Plagiarism Trends 2018–2025 report adds longitudinal analysis for country samples with sufficient historical coverage.
-
What is included in the country-trends report?
The 18-page report includes 17 Core country charts, 29 Contextual country rows, 30 Extended country sparklines, a shared annual platform baseline, and explicit sample-continuity rules.
-
Is the data anonymized?
Yes. The report uses aggregated data and does not include personal identifiers.
-
Can I download the underlying data?
The release provides the annual values in the HTML table, the main PDF report, the 2025 country appendix, and the longitudinal country-trends report. A machine-readable CSV may be added later only if it provides clear value.
Source and scope: PlagiarismSearch.com aggregated platform data for 2025, combined with the approved annual reporting series for 2018–2024. Figures describe submitted-document checks within the platform dataset and should be interpreted within the limitations stated above.