Global Plagiarism Report 2018–2024: What 69.89M Reports Reveal about COVID, AI, and Academic Integrity
Over the past seven years, 69.89 million documents have been submitted for plagiarism detection through PlagiarismSearch.com. This massive volume of academic, educational, and professional texts provides a rare opportunity to observe how writing behavior shifted globally — especially during key moments in recent history. From the early shockwaves of the COVID-19 pandemic to the rapid rise of generative AI tools, students and educators have been navigating new pressures and temptations. Online education, take-home assessments, and tools like ChatGPT have drastically reshaped how people write — and how they sometimes cut corners. The data behind this report is not hypothetical. It is drawn directly from real-world plagiarism checks conducted on our platform from 2018 to 2024, covering nearly every country and region in the world. The goal? To explore how academic integrity has evolved — and what we can learn from the numbers. This report covers:
- Year-over-year global trends in plagiarism rates
- Country-level patterns and anomalies
- The impact of COVID-era remote learning
- The influence of AI-powered writing assistants
This analysis offers a focused look at how integrity, technology, and external pressures have shaped academic writing in recent years. It reveals patterns that are both unexpected and deeply tied to global events.
Global Overview: Key Plagiarism Trends (2018–2024)
Over the span of seven years, the global average plagiarism rate followed a surprisingly dynamic trajectory. While many might expect consistent behavior across academic environments, the data shows a landscape in flux — shaped by global crises, digital transformation, and shifting educational norms.
| Year | Total Submissions | Avg Plagiarism Rate (%) | Δ vs previous year (%) |
|---|---|---|---|
| 2018 | 4.2M | 9.08 | - |
| 2019 | 5.8M | 14.67 | 61.55 |
| 2020 | 7.2M | 18.79 | 28.06 |
| 2021 | 10.3M | 16.72 | -11.01 |
| 2022 | 11.8M | 15.25 | -8.83 |
| 2023 | 13.9M | 18.32 | 20.19 |
| 2024 | 16.7M | 16.36 | -10.72 |
| Total | 69.89M | - | - |
Table 1. Annual Average Plagiarism Rate and Year-over-Year Change
The sharpest increase in plagiarism rates occurred between 2019 and 2020. Specifically, in 2019 the average plagiarism rate jumped by impressive 61.6%, and then again it increased by 28.1% just the following year. However, namely these years coincide with the COVID-19 pandemic and lockdown, which caused educational institutions turn to the remote mode of learning. While students were isolated and instructors faced significant challenges ensuring adequate supervision of the teaching process, academic integrity was hit until all aspects were adapted to the new online learning reality. Yet, the trend took an opposite direction, and the plagiarism rates declined by 11% and 8.8% respectively, hinting at a gradual return to structure and better oversight. These figures indicate that the educational system in general and separate institutions specifically started to implement changes in response the chaos of the pandemic and were able to regain foot in terms of controlling academic integrity among students in online setting. But stability didn’t last long. In 2023, plagiarism rates climbed again — this time by 20.2%. Unlike the COVID spike, this increase aligns with the growing use of AI-powered writing tools. With the launch of ChatGPT in late 2022, many began to explore or rely on generative tools to complete academic tasks, intentionally or otherwise. Interestingly, 2024 saw a notable drop of 10.7%. Whether this reflects better AI detection, institutional reforms, or a cultural shift around academic honesty remains to be studied further — but the turnaround is promising.
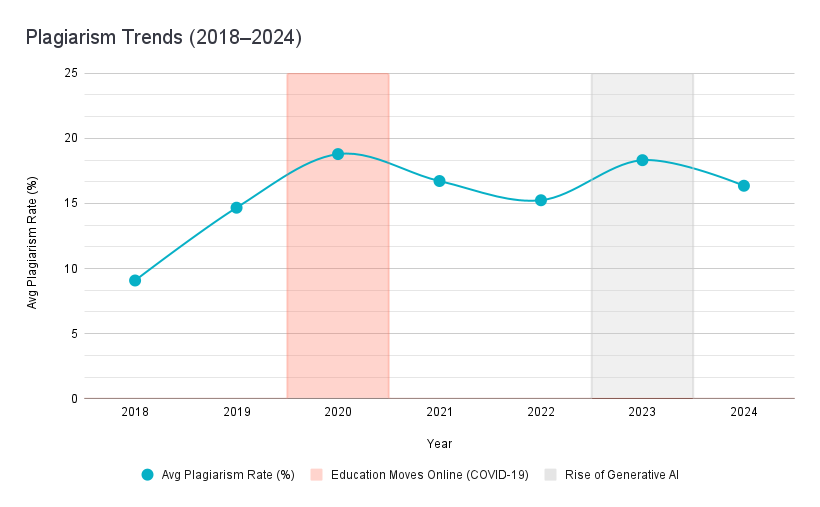
Figure 1. Yearly Trend in Plagiarism Rates (with COVID and AI Zones Highlighted)
Looking across the entire 2018–2024 period, the average global plagiarism rate settles at approximately 15.9%. While this number alone may not raise alarms, the sharp fluctuations around it tell a more complex story — one where context matters as much as the content itself.
What Drives Plagiarism: Key Influencing Factors
Numbers rarely speak for themselves. The sharp changes in plagiarism rates seen between 2018 and 2024 didn’t happen in a vacuum — they were closely tied to how the world, and particularly education, was evolving in real time.
1. The COVID-19 Shift (2020–2021)
When classrooms closed in early 2020, academic life was abruptly moved online. What began as a logistical challenge quickly became an integrity issue. Instructors lost the ability to monitor students directly. Exams were replaced with take-home assignments, essays, and unsupervised quizzes. For many, the sudden freedom from oversight created a new gray area. Copy-pasting, borrowing uncredited ideas, and using prewritten materials became easier — and more tempting. The data from this period reflects that shift clearly, with 2020 marking the single largest year-on-year increase in plagiarism across the entire dataset.
2. The Rise of Generative AI (2023–2024)
If COVID reshaped logistics, artificial intelligence changed the game entirely. By early 2023, AI writing tools were no longer niche — they were mainstream. Platforms like ChatGPT, Claude, and others allowed anyone to generate structured, fluent text in seconds. The temptation was real: no longer was it necessary to steal from a published source. Now, anyone could ask a machine to “write an essay on climate policy” or “summarize this article in original words.” Even if the text was technically new, the practice often blurred ethical lines — especially in academic settings. The 2023 spike in plagiarism rates suggests that many did explore these tools — whether out of curiosity, pressure, or a belief that AI-generated work wouldn’t be caught.
3. Other Contributing Pressures
Beyond COVID and AI, a range of other forces played a role. Academic pressure has intensified in many parts of the world. Students face higher expectations, language barriers, and increasingly competitive admissions. The ease of access to online information, combined with inconsistent teaching about citation and attribution, has also contributed. In some regions, anti-plagiarism enforcement remains weak or nonexistent — allowing dishonest habits to go unchecked. Taken together, these elements paint a complex picture. Plagiarism is rarely just a choice; it’s often the outcome of circumstance, opportunity, and the absence of meaningful deterrents.
Country-Level Analysis: Regional Contrasts in Plagiarism Dynamics
While global averages are helpful for spotting overarching patterns, they often mask the dramatic differences seen between individual countries. Culture, policy, infrastructure, and educational practices vary — and so do the trends in plagiarism. Below is a snapshot of ten countries that stood out in our data. Some saw sharp peaks during the pandemic; others remained stable despite global disruption. In certain cases, the rise of AI had a measurable impact, while in others, rates declined even as new tools became available.
| Country | 2018 | 2019 | 2020 | 2021 | 2022 | 2023 | 2024 | Max | Min | Range |
|---|---|---|---|---|---|---|---|---|---|---|
| India | 25.0 | 28.0 | 23.6 | 22.0 | 19.5 | 26.4 | 18.2 | 28.0 | 18.2 | 9.8 |
| Germany | 13.7 | 11.2 | 7.5 | 5.8 | 8.0 | 8.7 | 5.0 | 13.7 | 5.0 | 8.7 |
| United States | 9.8 | 22.0 | 29.0 | 20.1 | 22.3 | 26.7 | 26.9 | 29.0 | 9.8 | 19.2 |
| Turkey | 6.3 | 8.7 | 7.3 | 8.6 | 10.1 | 9.3 | 8.8 | 10.1 | 6.3 | 3.8 |
| Philippines | 15.1 | 25.9 | 20.6 | 15.6 | 13.4 | 11.1 | 9.2 | 25.9 | 9.2 | 16.7 |
| Nigeria | 21.8 | 26.4 | 20.1 | 12.7 | 16.3 | 10.6 | 11.9 | 26.4 | 10.6 | 15.8 |
| Bangladesh | 26.7 | 39.5 | 29.7 | 30.3 | 25.9 | 18.8 | 14.4 | 39.5 | 14.4 | 25.1 |
| Brazil | 21.1 | 19.0 | 22.9 | 23.0 | 21.1 | 20.2 | 29.5 | 29.5 | 19.0 | 10.5 |
| Ukraine | 5.5 | 6.4 | 6.5 | 5.9 | 6.3 | 6.6 | 6.3 | 6.6 | 5.5 | 1.1 |
| Mexico | 12.5 | 18.7 | 20.1 | 16.5 | 17.0 | 15.9 | 14.4 | 20.1 | 12.5 | 7.6 |
Table 2. Ten Countries with the Most Notable Plagiarism Dynamics (2018–2024, %)
Key Insights by Country
- India: Persistently high levels of plagiarism, with a clear spike during the early pandemic years.
- United States: Saw one of the largest year-over-year jumps in 2020, maintaining elevated rates through the AI surge in 2023.
- Bangladesh: Peaked dramatically in 2019, followed by a steady and consistent decline through 2024.
- Turkey: Remarkably stable across all seven years — minimal variation despite global trends.
- Mexico: Displayed a sharp rise in 2020, likely COVID-related, with gradual decreases in the following years.
- Germany: Maintained some of the lowest overall rates, showing steady improvement and minimal volatility.
- Nigeria: Showed a wave-like pattern, with peaks during both COVID and the rise of AI.
- Philippines: Experienced strong increases in 2019 and 2020, but adapted quickly, with notable drops by 2024.
- Ukraine: Generally moderate levels, with minor fluctuations and no extreme spikes.
- Brazil: Showed signs of recovery post-2020, but saw a late uptick in 2024, potentially tied to AI use.
These examples reflect just a fraction of the broader dataset. The full report includes over 90 countries, each with its own unique trajectory.
Conclusion & Key Takeaways
Plagiarism is not a fixed metric. It moves — and sometimes swings sharply — in response to events far beyond the classroom. Over the past seven years, the data reveals how deeply academic integrity is tied to global change. The largest shifts in behavior didn’t occur gradually. They happened when systems were disrupted: first by a global health crisis, then by a wave of technological innovation. In both cases, students and institutions were caught in moments of uncertainty, often without clear rules or resources. Even countries with historically low plagiarism rates showed signs of vulnerability under pressure. No region is immune — and no single solution works everywhere.
What Can Be Done?
- Develop smarter tools — AI shouldn’t just be a threat; it can also be part of the solution. Detection and prevention must evolve together.
- Invest in academic literacy — Teaching students how to write, cite, and research ethically is more effective than punishment alone.
- Track data regularly — Trends shift fast. Ongoing analysis helps institutions stay ahead of new challenges and respond proactively.
As the tools and pressures around us continue to evolve, so must our approach to academic honesty. Transparency, adaptability, and insight-driven action will be key to building a more resilient system for the years ahead.
Read the Full Reports
This article offers just a glimpse into a much larger body of data. If you’d like to dive deeper — explore full-year breakdowns, country-level patterns, or the methodology behind our analysis — the complete PDF reports are available below.
For questions, citations, or media inquiries, feel free to contact us at info@plagiarismsearch.com.